Of cholera and k-means: how data science and clustering has helped in the past, and what it can do for the future
Whether it is solving last-mile connectivity issues, or simply figuring out what caused the cholera outbreak in London, data science and clustering has always stood us in good stead. Here is why we need to use it more to solve real problems.

On the face of it, it seemed like just another day of science learning for my child, and data science for myself. But little could I imagine that when I was reading about cholera in my son’s science textbook in the morning or while applying k-means clustering to a dataset later in the day that there was even the remotest of connections between the two.

Model of the Cholera Bacteria at the Smithsonian museum of Natural History
Soon enough, I understood that the k-means clustering was not working on the dataset and then came the sudden realisation that the k-means was a non-convex function, and there I was veering towards getting a mathematical proof of the same, suddenly peering into Hessian matrices and the like. Soon enough I found myself plotting the cost function and staring into what seemed like a saddle of an horse! Worry not if you think you are mathematically challenged, let me quickly explain the k-means clustering algorithm and then I will let you partake in my worries of making the algorithm work.
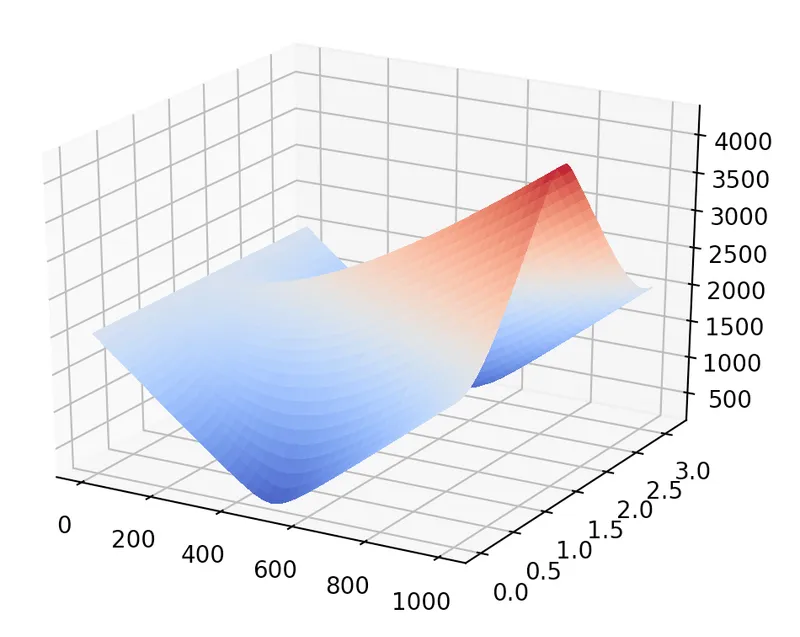
K-means cost function
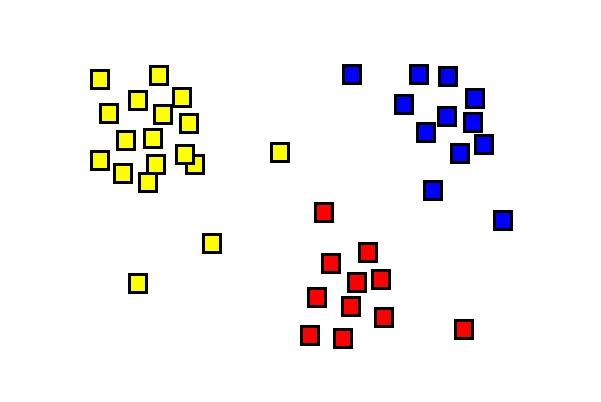
The k-means clustering algorithm attempts to separate a bunch of points into k groups — each group containing points that are similar to each other — in mathematical parlance similar here would mean close to each other. The figure below shows the points grouped into three clusters — red, yellow, and blue.
How does the algorithm work?
Initialisation
Start by first randomly choosing k cluster centroid points.
Iterative step
Repeat following till clusters don't change.
- Assign all points to cluster of the nearest centroid.
- Recompute centroids
Here is a visualisation of how the k-means algorithm would proceed on a random sample using the visualisation tool).
As I was researching about the cases where k-means could be applied and if I should switch my loyalties to a different clustering algorithm, I stumbled upon some interesting things in history.
The miasmic cloud
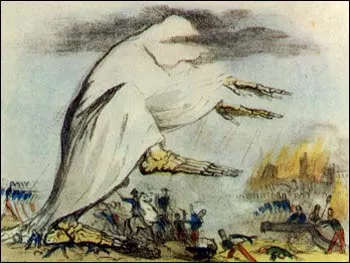
Miasmic cloud illustration in the 19th century
It was somewhere in the middle of the 19th century when a strange new epidemic called Cholera claimed lives across Asia, Africa, and Europe. The dominating theory was that of a disease cloud — referred to as the miasmic cloud — travelling across the globe killing people on the way.
This John Snow knew things
However, one doctor, who interestingly goes by the now popular, yet differently spelled, name of 'John Snow' suspected that water contamination was the cause of the outbreak. However, it was difficult to pinpoint to it since the deaths seemed to happen all over London affecting some and leaving some untouched.
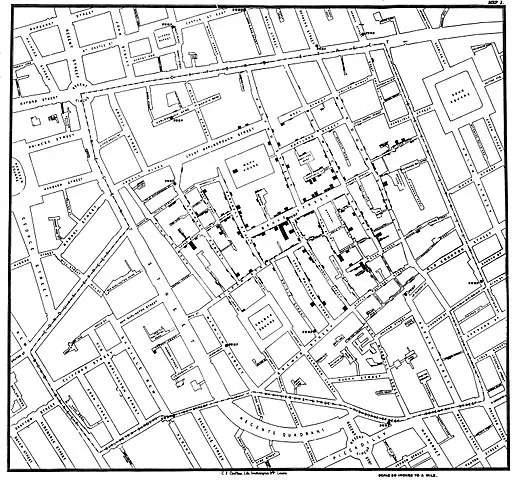
Original image of the clustering Dr.Snow had done on the map
That is when Dr John Snow decided to apply the k-means clustering algorithm (referred to as the Voronoi diagram back then) on the set of people who died. He marked the places where the deaths happened on a map and used that data to cluster. An interesting pattern emerged — almost every death cluster seemed to be near a water pump served by a particular water company that supplied the water from the Thames without filtration.
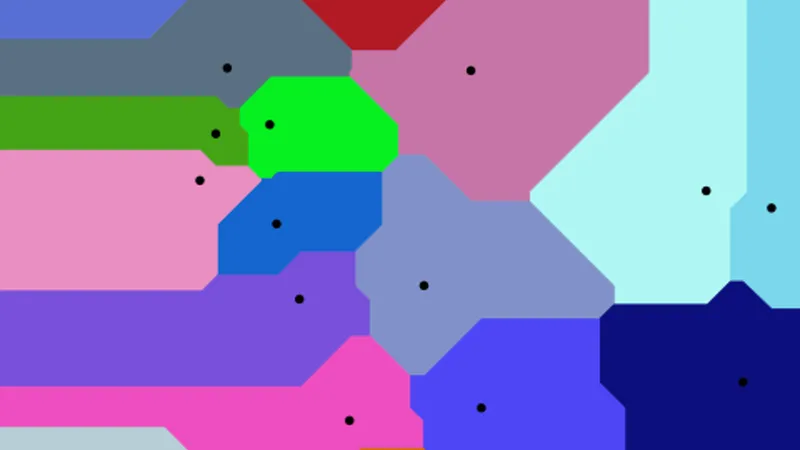
Voronoi diagram splits area into regions served by its nearest water pump (shown as dot)
There were no clusters next to water pumps that had water supplied by companies that performed filtration. And Dr Snow had successfully discovered the cause of cholera by applying data science to a biological problem in the 19th century.
In the modern era
In the modern world, there are several applications of clustering. Think of the situation in the morning — you are trying to book a cab for office and there are no cabs available. This could happen due to a variety of reasons from under-supply of cabs to cabs not being positioned at places where demand exists at that point of time. I shall call the latter as the “fleet placement problem”.
Is there a way we could use clustering to identify locations where the taxis must be distributed to better serve passenger demand then? Assume that you have historical data of passenger booking locations at that time of day. Give yourself a minute to think about this before you proceed to the solution below.

Clustering: A solution for the taxi fleet placement problem
All you need to do is cluster the locations of passenger demand into 'k categories' using the k-means clustering algorithm. Extra brownie points to you if you figured out that 'k' is nothing but the size of the taxi fleet —ie, the number of active taxis that the company has at that point of time. Now the company could guide the taxi drivers to position their taxis around the cluster centroids to maximise their chances of getting customer rides.
Startups doing door-delivery of services, be it an online restaurant or a ecommerce store, could actually apply clustering algorithms to bring in efficiency into their delivery process. An online restaurant could use the clustering algorithm to find places to have their kitchens to aid quicker delivery. An ecommerce store could apply clustering algorithm in a similar manner to decide on locations of their warehouses to make their last-mile delivery cost-effective.
I have listed a few more examples that should relate to both the cholera problem as well as the examples above.
- A telecom company determining locations for installation of mobile towers based on their subscriber locations
- A bike/bicycle rental company figuring out the ideal parking/pickup spots for their bikes/bicycles based on rider locations
- Hospital chain determining locations to open emergency care centres near accident-prone zones
- Determining product placement in a retail supermarket store based on products frequently brought together
- Classical use-case of clustering users in an ecommerce website/app to do better cross-recommendation of products (referred to as the collaborative filtering problem.)
At this juncture, I cannot miss stating another wonderful application of clustering that is close to my heart since it was something that I personally worked on — Google News clustering. Google News works by clustering news articles together thereby bringing in articles written on the same story together. The clustering not only brings in diversity and perspective but in fact helps readers figure biases in reporting— a particularly valuable tool in today’s world of propaganda, jingoistic reporting, and fake news — which I daresay is the equivalent of miasmic cloud type stories propogated in the 21st century.
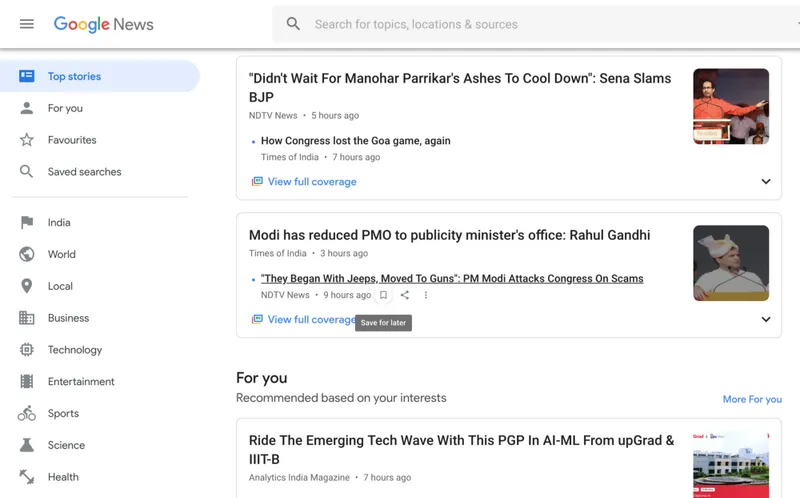
Google News clustering
How Google News works
The Google News crawler continuously crawls articles from various sources across the web. A simplistic version of the algorithm would extract the most important keywords from every article and then apply clustering algorithms on the article keyword vectors. One could use word embeddings to represent the article vectors. Finding the right k is always a challenge in the context of an application like news since the number of stories in a day would vary from day to day. A potential algorithm could be to try out values of k and zeroing in on one that minimises the cost function, apart from the option of other clustering algorithms.
Get off the high horse
Now back to the saddle function where I was stuck— the problem is one of local minima — essentially we need the algorithm to literally get off the high horse since the back of the horse has a local minima where it can get stuck. Thankfully, there are multiple ways to solve this problem:
- Pick the initial cluster centroid values in such a way that it has lesser chances of falling in the horse’s back and more leaning towards the sides
- Run the algorithm a bunch of times (if it is possible) to retrieve the best possible clustering.
- Bring in random perturbations by probabilistically assigning clusters in each step than determinism. This might avoid settling in the horse saddle.
Now that we are off the horse saddle, we can perhaps admit that it turned out to be one hell of a horse ride into history — wasn’t it?
(Disclaimer: The views and opinions expressed in this article are those of the author and do not necessarily reflect the views of YourStory.)