Revenue attribution to banners on your website: Google Analytics hack for startups

All e-commerce companies are striving to achieve the maximum click through rates (CTR) and conversion rates. The content, images, banners, and all promotional paraphernalia are made in such a way as to drive maximum click-throughs and to facilitate maximum transactions.

Image credit: Shutterstock
So, in this kind of a scenario, analytics is very important to understand what kind of products, images, and banners are doing good.
If you are an e-commerce company you would be able to relate to the following:
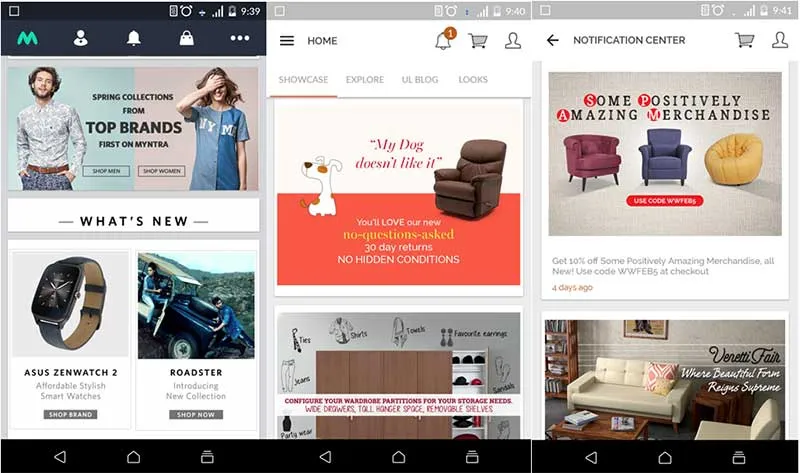
You have n number of products, which you try selling using banners/creatives. You try some creatives on your home page, some for the push notifications, some in the notification centre and many in other places. Basically, it's images everywhere that drives clicks.
Check out the home page of Myntra, Urbanladder, Chumbak, Flipkart, Snapdeal etc. All these apps are images (i.e., banner)-intensive.

You generate some x revenue, which is growing incrementally or in some situations decreasing for reasons unknown to you.
Now here comes the problem:
You don't know which banners are working, and which are not. CTR (total clicks on that banner/total views of that banner) doesn't provide you a clear picture. Even getting that accurately is a hassle. You don't get to know which banner is contributing to what extent to the revenue. You have a design team, which creates banners according to their whims and fancies. You don't know the correlation between a particular type of banner and the revenue it contributes to the company. So, predictably, you have no idea what kind of banners should be used more.
Sometimes the banners that look great to our eyes don't provide good CTR and ATC.
A good performing banner is not just an aesthetic thing. There is a lot of science and analysis that goes into understanding what kind of fonts, colours, and creatives click with a company's target segment.
Being a startup, how can you do such a kind of analysis without spending a penny?
Google Analytics provides you enhanced e-commerce option, which enables the businesses to track product performance, add to carts, revenues etc. You can use this feature to know revenues made from each product and category.
How can you use the same tool to get analytics for banners and, more importantly, attribute monetary value to these banners?
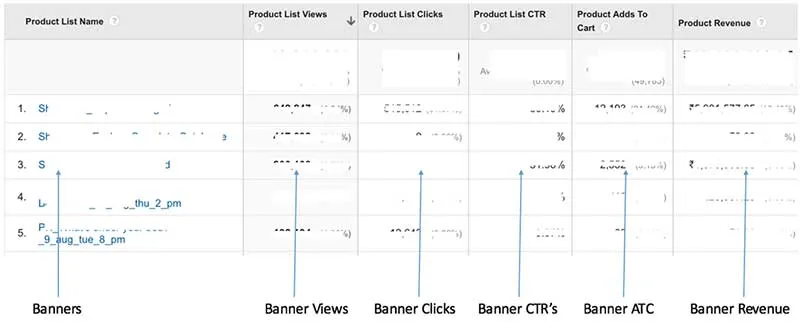
Here is the hack. You create a new Google Analytics account and choose 'banners' as product lists. Each banner is a product list with associated product list views, product list clicks, CTR, add to carts and revenue.
The step-by-step process on how to achieve the desired analytics:
- For every banner viewed, a Product List View is added to that banner.
- For every banner clicked, a Product List Click is added to the banner.
- Product List name is set such that we will be able to uniquely identify the banner, and the place of the banner <Page>-<Banner Title>-<Date> eg: Homepage-Shirtid_2-20022016, PushNotification-Trouserid_23-20092015
- Google Analytics will automatically start calculating clicks/views, CTR for the banners. Looking at the CTR, you can find out which banners get the highest clicks. But sometimes a banner getting fewer clicks can also result in more ATC and transactions.
- For every product add to cart, we associate it with the Product List name, which is the last clicked banner in this case.
- For every transaction, we start pushing an enhanced e-commerce event, associating it with the product list, which again is the last clicked banner here.
If the add to cart/transaction happens from hamburger navigation, or search, or any other navigation without clicking any banner in that session, that is attributed to 'no banner' in that case. (You can have other broad categories like Search, Notification Centre, Hamburger and the ATC and revenue is attributed to these bigger groups instead of banners in that case).
Terminology
- Banner views: This will add the view counter for banners viewable on screen. Only once the complete banner comes on the screen will its view be added.
- Banner Clicks: Clicks on all the banners
- CTR : This is automatically calculated as clicks/views in GA
- Last Banner Clicked: Need to track the last banner clicked. This is reset if the session expires. For a new session, this field will be
- Add To Carts: Attributed by GA itself, if you send ATC events to enhanced e-commerce GA
- Transactions and Revenue: Attributed by GA itself, if you send transactions and revenue events to enhanced e-commerce GA
For push notification banners:
- Push Notifications Receive: All the push notifications receive will be added as push notification Views.
- Push Notification Clicks: Push notification clicks will be saved for computing the notification banner CTR
- Last Click will keep using the same model where it saves the last banner clicked and attributes the revenue / add to carts to last banner or push notification clicked.
The final view should look something like this under the enhanced e-commerce Product List Performance section:
(Disclaimer: The views and opinions expressed in this article are those of the author and do not necessarily reflect the views of YourStory.)
MOST VIEWED STORIES