From smart data to rich insights: 5 tips on aligning Big Data with your business compass
Has this article been penned by a writer or a smart programme? After all, companies such as Narrative Science have developed software products to automatically generate sports stories and business performance reviews by using combined analytics and story templates!

Sectors ranging from healthcare and athletics to logistics and media are being transformed by ICTs, data, and analytics. The rise of the Internet drove a big spurt in digital information gathering and dissemination, followed by mobiles, social media, and the Internet of Things (IoT).
Thanks to ubiquitous data gathering, it is now possible for companies to ‘know what is happening as it is happening’, and take the right responsive decisions in real time, says strategy consultant Bernard Marr in his new book, Big Data: Using smart big data, analytics and metrics to make better decisions and improve performance (see also my reviews of the books Big Data Revolution, Big Data Marketing, and BigData@Work).
Bernard is Founder and CEO of Advanced Performance Institute, and author of the bestsellers Key Performance Indicators, The Intelligent Company, and Strategic Performance Management. He has advised companies such as Accenture, Astra Zeneca, Barclays, BP, DHL, Fujitsu, Gartner, HSBC, Microsoft, Oracle, Orange, Tetley, T-Mobile, Toyota, SAP, and Shell.
His book is packed with frameworks and case studies of Big Data in action. For example, professionals are using basketballs with 200 embedded sensors to monitor performance, and so are rugby players with wearable GPS trackers and cycling teams with pedal sensors.
Healthcare companies are using cloud provider Ginger.io to power apps on smartphones of patients and track compliance with medication programmes. Hospitals in Canada and the US (for example, Kaiser Permanente) are gathering and tracking data on infant patients to flag abnormal symptoms in premature babies.
Smart TVs can use face recognition to ensure that children don’t watch adult content. Analytics are being used in dating sites, and there are even ‘smart carpets’ that can detect unusual walking patterns of elder citizens.
Internally, some companies are tracking employee activities and discovering interesting correlations. For example, those who set up non-standard web browsers and other tools are more likely to take initiatives on their own in other tasks.
Machinery manufacturer John Deere uses tractor sensors to forecast demand for spare parts, and shares insights for farmers online via MyJohnDeere.com and FarmSight services. Amazon’s S3 system tracks millions of stock items in real time in warehouses and supply chains.
The software tool Evolv tracks employee movement and networking activities via smart badges. Bank of America analysed performance metrics to come up with recommendations for employees to take breaks together.
Some of these Big Data tools and analytical insights can come from outside corporate firms, via startups; Cisco has announced a $150 million fund to engage with startups in this space (see also my article, 15 innovation tips: how large corporations can successfully engage with startups).
Bernard’s book is based on his SMART approach to business, an acronym derived from strategy, metrics, analytics, reporting, and transformation. “Most businesses are already data rich, but insight poor,” he begins.
Much media attention has focussed on the Big Data successes of giant firms which have lots of budget, time, technology and talent – but even SMEs and especially digital startups can begin by combing their own ‘small data’ with Big Data. Here are my key takeaways from the 246-page book, divided into five sections.
- Start with strategy
Companies should focus not just on gathering all the data they can, but begin with a sufficient quantity of the right data that can yield actionable insights. To determine which data companies need, they should begin with a useful tool called the SMART Strategy Board, which will help map business activities and come up with the right prioritisation for fact-driven insights and decisions (see Fig. 1).
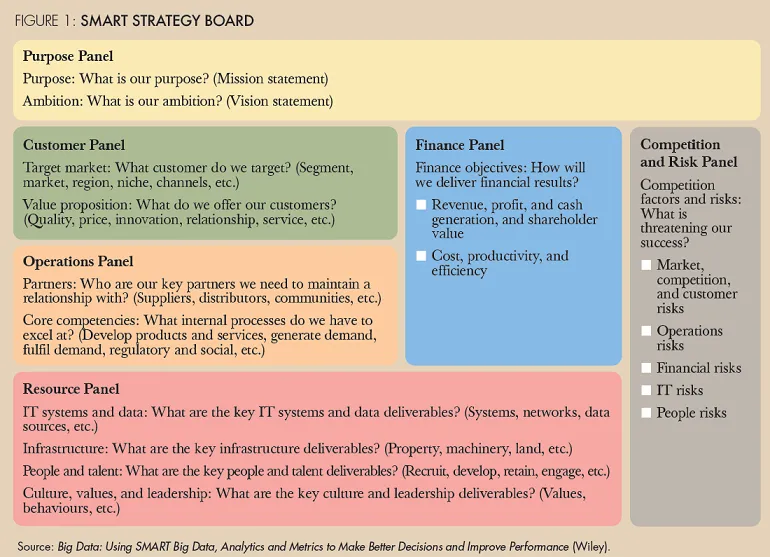
This tool allows companies to step back and understand their core information needs for strategy and operations. Instead of ‘collect everything just in case’, the data gathering approach should be to ‘collect and measure x and y to answer question z’.
Framing questions should be drawn from management teams focusing on purpose, customer, finance, operations, resources, and competition, for example, how to target a new market, how to increase profit per customer, what are the performance gaps. “Smart questions are the answer,” advises Bernard.
Google’s Project Oxygen used internal analytics to find the eight characteristics of good managers, and the three pitfalls facing underperformers; this was used to devise better training programmes and rating schemes.
Even small retailers can use smartphone sensors to track how many users pass their stores, how many pause at the window, and how many come in; this can be correlated with actual purchase numbers to map and improve pedestrian inflow. Combining data sets can yield new insights, for example, correlating purchase patterns with weather data to influence seasonal purchases.
- Measure metrics and data
Once the key questions and data needs are framed, companies need to draw up tables of what kinds of data they need, and which data sets fill these needs. The world is being increasingly ‘datafied’, and business model components should be examined for data gathering activities and analysis.
The author classifies data along a number of dimensions: structure (structured/unstructured), ownership (internal/external), source (activity, conversation, social multimedia, smartphone sensors, IoT), and creation (surveys, transactions, ratings, aggregation, experiments, UGC). Each category itself differs in terms of its volume, variety, velocity, veracity, and value (‘5 Vs’).
For example, this categorisation helps companies find out which data sets answer critical questions: supply chain movements, cash flow, customer feedback, machine data, fraud rates, social media trends, and so on.
- Apply analytics
“Data and analytics go hand in hand,” says Bernard, and classifies analytics into three types – text, speech, and video/image. Text analytics includes categorisation, clustering, concept extraction, sentiment analysis, and summarisation. For example, the tool Twitrratr helps companies with real-time sentiment analysis of positive, negative and neutral tweets. Gatorade and Dell have ‘media command centres’ to track social media developments about their products, and can make real-time changes to promotions and messaging.
Speech analytics is used in call centres, car-smartphone interfaces, and in voice command interfaces like Siri. Verizon has filed a patent to allow it to watch and hear users when they watch TV, track conversations, and play responsive ads.
Video content analytics is used for identification (‘faceprints’), behaviour analysis, and situation awareness. Examples include pattern recognition by Google’s NameTag and Facebook’s DeepFace. CCTVs are used to track and predict customer movements in stores, as well as by police forces to track criminals.
Even mining of social media likes and recommendations yields insights on user preferences and personalities which users themselves have not explicitly indicated in their online profiles.
- Report results
“Reporting is in the middle of an extensive and exciting makeover that promises to help unleash the true potential of data,” says Bernard, pointing to the rise of infographics and open source data visualisation tools. These include tools to display text, data, maps, behaviours and connections, for example, PolyMaps, word clouds, DS.js, Crazy Egg heat maps.
“This type of approach enables much more sophisticated storytelling, and offers fresh and important insights into solutions,” says Bernard. Successful design calls for effective cooperation between data, design and management teams, so that the resulting displays are visually attractive, capture useful content, and impart knowledge of facts and deductions. The visualisation ‘dashboard’ should highlight answers to the earlier framed questions on strategy and operations.
For example, Procter & Gamble has institutionalised data visualisation as a primary tool for management, and has harmonised all reports with a visual analytics software vendor so as to ensure consistency.
- Transform business
Specific outcomes of smart data include better customer segmentation, reduction of customer churn, prediction of customer activities, increase in stakeholder satisfaction, cross-selling and up-selling, business process optimisation, lower business risk, and overall performance enhancement. Data discovery can even yield new useful questions to frame, new business models, improved services, and new products as well, for example, from mining aggregated collective data.
For example, Target has developed purchase pattern insights that can predict if a buyer may be pregnant. IBM SlamTracker is used to track tennis performance in tournaments, and Manchester United hires data scientists to develop new winning strategies in football.
Rolls Royce uses sensors in its jet engines to offer better servicing programmes for its airline customers; servicing now accounts for 70 per cent of its revenues. GE’s ‘Industrial Internet’ initiative hopes to save millions of dollars a year in its gas turbine fleets. Jawbone is no longer just a device company but a data company which can generate useful insights on healthy sleeping patterns (for example, for frequent travellers).
Boston citizens download apps which track sudden movements of cars due to potholes; this information is passed on to municipal authorities to repair roads. Hotel chains augment customer insights by tracking posts on TripAdvisor. Walmart discovered that hurricane warnings were followed by increased purchases of Pop-Tarts (!), and stocked boxes of them in front of the store to boost sales.
Telcos use Big Data for commercially significant insights, for example, to track customer churn. Financial services firms monitor transaction patterns which may predict fraud. Insurance companies use smartphone or in-built sensors to track driving patterns and offer appropriate policies. Manufacturers use Big Data to track increases in vibration rates and conduct predictive maintenance and repair.
The road ahead
In the coming years, data gathering devices will only continue to proliferate. Electronic components already account for a third of a car’s cost, according to the author (see my reviews of the related books Code Halos and Connected by Design). But there are also serious issues over privacy, ownership, security, IP, transparency, responsibility and ethics.
Bernard advises Big Data users to be cautious and factor in modelling inaccuracies, and calls for clear consumer guidelines on user privacy and data ownership (for example, the right to forget or erase). Anonymisation techniques can help address concerns over individual disclosure.
“Big Data and analytics are here to stay and it's only going to get more sophisticated. We need to embrace it, operate it effectively, deliver value in exchange for the data, and apply its significant benefits for the betterment of our world,” advises Bernard.
“Ultimately, access to data and the ability to analyse it allows us all to review evidence and make better decisions based on fact: not assumption, experience or gut feeling,” Bernard sums up.